Companion is a great place to view all your campaign content in one place and get insight on post performance. Here is our guide to content and their metrics on Companion.
- From your Companion home page open the content tab

You can also accesses content from any bookmarked campaigns on the home page

Or to see content from a specific campaign, first open the ‘Campaigns’ tab, select your desired campaign and click the ‘Campaign content’ tab to the left of the screen.

Instagram content
Main Feed Posts

The first thing you will see when you open a main feed post is the caption displayed to the right of the image

Just below Companion generates some estimated post metrics including :
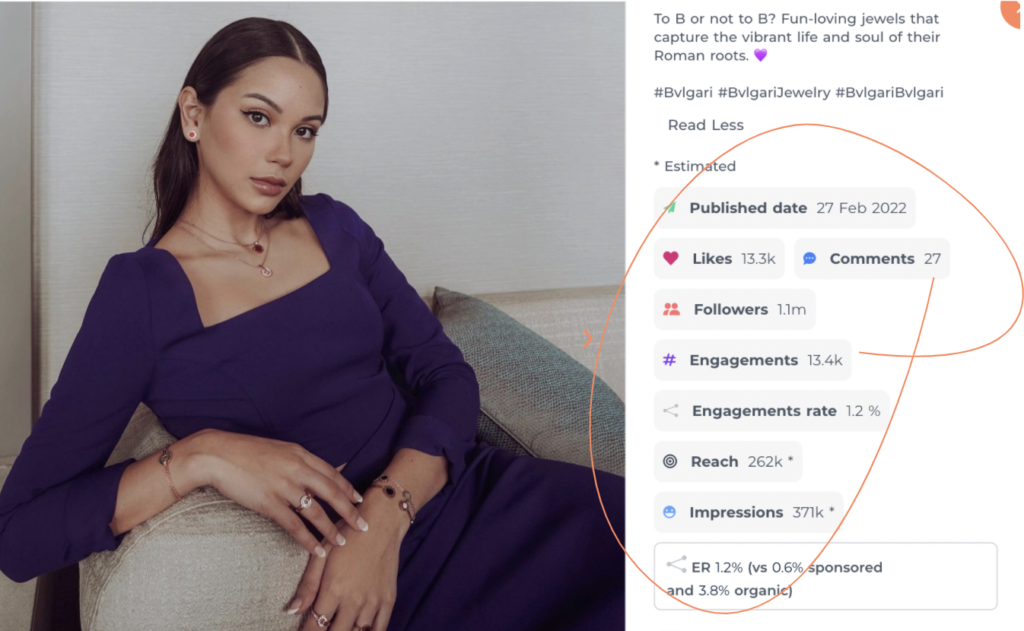
The date the content was posted

The number of likes/comments the content received
The number of overall engagements
The post’s engagement rate (ER)
The influencer’s follow count
Estimated reach

Estimated number of impressions
Below the estimated metrics there is an orange button marked ‘Go to post’ with a link to the original piece of content.

Reel/IGTV content

Instagram reels/IGTV content have a couple of extra metrics! Including :
View count (The video was watched for at least three seconds)
The number of plays the video received
Story Frames

When you open a piece of story content, Companion will generate some key metrics to the right of the image.

Story metrics include :
The date the content was published

The influencer’s follow count

An estimated reach

and the estimated number of impressions
TikTok Content
TikTok content is also supported on Companion. Just like with instagram content when you open up a TikTok video on Companion estimated metrics will be generated to the right of the campaign content

For TikTok content Companion will generate the following estimated metrics :
The date the content was published :

How many likes and comments the content received :
The influencer’s current follow count :
The number of views the video received and how many people chose to share it :

The total number of engagements
And last but not least, the content’s engagement rate :

Youtube content
Youtube content is also supported by Companion. Again, metrics can be found to the right of the content when you select a post.
Companion’s Youtube metrics include:
As usual the date the content was posted
The amount of times the content was viewed
The number of likes, dislikes and comments the video generated :

A sum of the total engagements :

The influencer’s follow count…

And lastly the video’s engagement rate :

Twitter Content
Twitter is another platform we support on Companion.
When you open up a piece of Twitter content any generated metrics will appear to the right of the content image
The first metric for Twitter content will be the publishing date:
The stats also include the number of likes and retweets the content received :

As well as a summary of the overall engagements :
And finally the post engagement rate :